
Debugging.md 1.8KB
Debugging.md 1.8KB
React Native WebView Debugging Guide
Here are some helpful React Native WebView debugging tips.
Debugging WebView Contents
iOS & Safari
It’s possible to debug WebView contents in the iOS simulator or on a device using Safari Developer Toolkit.
Steps:
- Open Safari Preferences -> “Advanced” tab -> enable checkbox “Show Develop menu in menu bar”
- Start app with React Native WebView in iOS simulator or iOS device
- Safari -> Develop -> [device name] -> [app name] -> [url - title]
- You can now debug the WebView contents just as you would on the web
Notes:
When debugging on device you must enable Web Inspector in your device settings:
Settings -> Safari -> Advanced -> Web Inspector
Also, if you don’t see your device in the Develop menu, and you started Safari before you started your simulator, try restarting Safari.
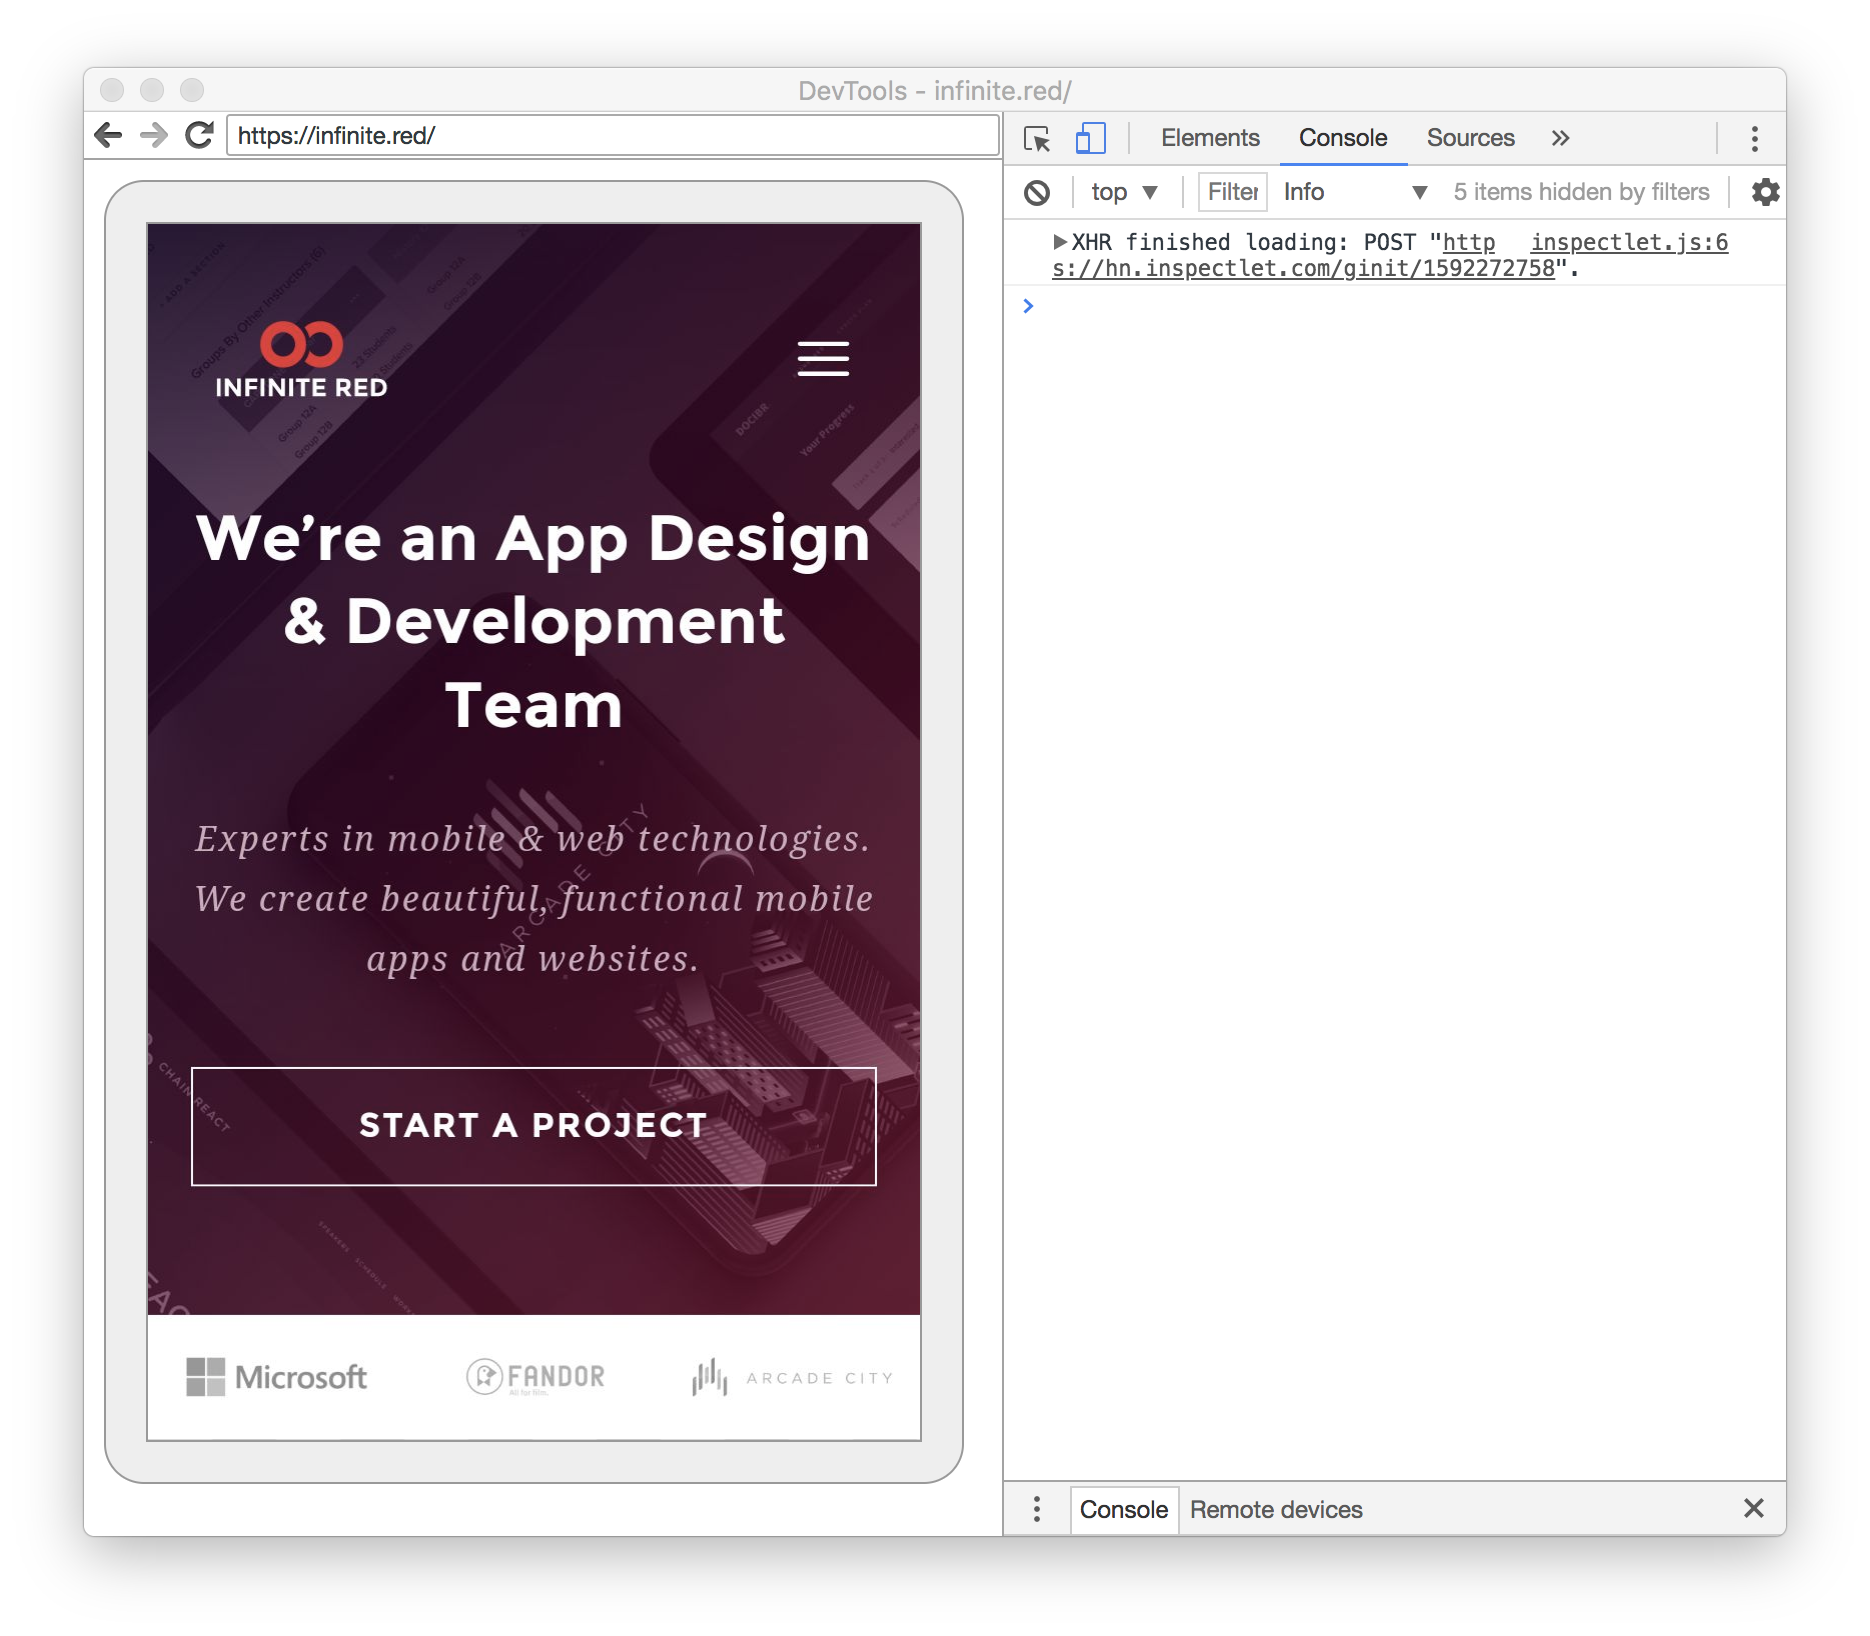
Android & Chrome
It’s possible to debug WebView contents in the Android emulator or on a device using Chrome DevTools.
- You will need to make the following change to
MainApplication.javato enabled web contents debugging: ```java import android.webkit.WebView;
@Override public void onCreate() {
super.onCreate();
…
WebView.setWebContentsDebuggingEnabled(true);
} ```
- Start app with React Native WebView in Android emulator or Android device
- Chrome -> DevTools -> Menu (3 dots) -> More tools -> Remote devices
- Select your device on the left and select “Inspect” on the WebView contents you’d like to inspect
- You can now debug the WebView contents just as you would on the web
Note:
When debugging on device you must enable USB debugging in your device settings:
Settings -> System -> About Phone -> Developer options -> enable USB debugging